Like swinging a bucket of water above your head and staying dry or throwing clay on a potter’s wheel and wearing it.
The lower the pressure, the higher the pump can “suck”
It is this simple – this is the major part of pump theory!
Understand this, and NPSH is easy!
In fact, nothing does.
Many things in our world work in the same way, by creating a low pressure area and allowing higher pressure air to apply force to water, air, or an object. This force explains the workings of:
Centrifugal pump performance is represented by multiple curves indicating either:
Various impeller diameters at a constant speed.
Various speeds with a constant impeller diameter.
The curve consists of a line starting at “shut head” (zero flow on bottom scale / maximum head on left scale). The line continues to the right, with head reducing and flow increasing until the “end of curve” is reached, (this is often outside the recommended operating range of the pump).
Flow and head are linked, one can not be changed without varying the other. The relationship between them is locked until wear or blockages change the pump characteristics.
The pump can not develop pressure unless the system creates backpressure (ie: Static (vertical height), and /or Friction Loss). Therefore the performance of a pump can not be estimated without knowing full details of the system in which it will be operating.
Refer to the figure below for a sample curve showing (text colours relate to colours used in fig.2):
Three performance curves ( various impellers or speed).
Curves showing power absorbed by pump (read power at operating point, see note 1).
Best efficiency point (BEP).
Recommended operating range(operation outside this range reduces pump life).
Nett Positive Suction Head required by the pump (NPSH [R] ).
The circled numbers indicate the following for bottom curve (ie: smallest diameter impeller or slowest speed curve shown):
Maximum recommended head.
Minimum recommended head.
Minimum recommended flow.
Maximum recommended flow.
The points referred to as “shut head: and “end of curve”.
Note 1: Power absorbed by pump is read at point where power curve crosses pump curve at operating point. However this does not indicate motor / engine size required. Various methods are used to determine driver size.
| These details required for all applications | Additional details if liquid is not water. |
| Flowrate required Static suction head Suction pipe inside diameter Footvalve or open pipe Suction pipe length & material Static discharge head Discharge pipe inside diameter Discharge pipe length & material Temperature Details of solids Height above sea level Details of application ie: – additional requirements, – sprinklers or other pressure requirements – future expansion, etc | Full liquid description
Specific gravity
Viscosity
pH value
Other details or data sheet
FOR ALL APPLICATIONS ADVISE: Driver requirements ie: Electric? – voltage/phase/Hz Electric? – hazardous location? Diesel? – preferences Petrol? – preferences Hydraulic? – system available |
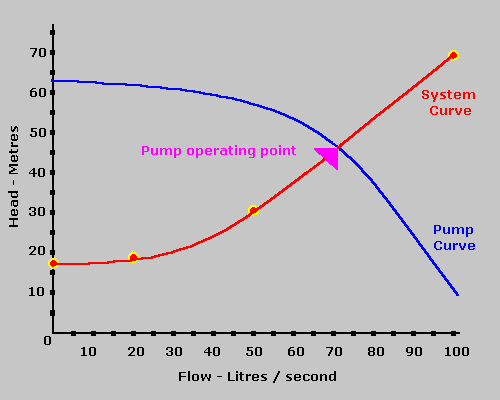
System curves allow correct selection of pumps and are invaluable in troubleshooting of pump problems.
To draw a system curve, follow these steps & refer to fig1:

The above method shows the basics for drawing a system curve for one pipe connected to the discharge of the pump. What if there is more than one pipe?.
If 2 or more pipes are connected to the discharge of a pump, the flow through each pipe can be added together at a common head. The combined flowrate can then be plotted as a system curve. Use the highest Static Head at zero flow on curve.
If there is a common section of pipe before the multiple branch lines, you must first do the above step then calculate friction through the common section (at the combined flow of the multiple branches) then add that to the “common head” used above. Use the common section Static Head plus the highest Static Head of the multiple lines as the head at zero flow on the curve.
You will need to use two calculators:
Enter flowrate to calculate headloss
and
Enter headloss to calculate flowrate
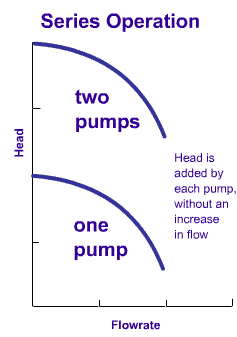
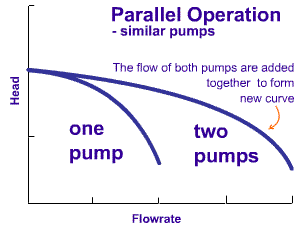
The use of two or more pumps to increase flowrate is called Parallel pumping. The use of two or more pumps to increase head (pressure) is called Series pumping. Operation of pumps under these circumstances may appear simple, but there are more complex issues to consider, ie:
 | In series applications: consider the pressure rating of pump, shaft seal, pipework and fittings. Placement is critical to ensure both pumps are operating within their recommended range and will have a constant supply of water. Drawing a curve for 2 or more pumps is simple, draw 1st pump curve then draw 2nd curve, adding the head each pump produces at the same flow. More curves can be added in the same way. |
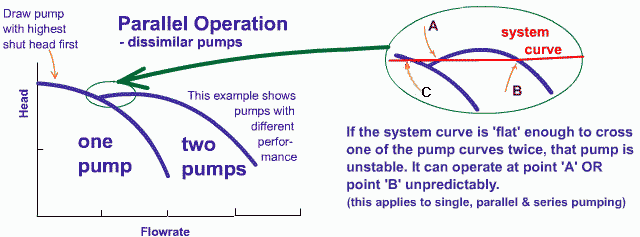
In parallel applications: confirm suitability of pumps by drawing a system curve (often 2 pumps will only deliver slightly more than one pump due to excessive Friction Loss. Also you can confirm that pump operation will be within its recommended range.). Non return valves are required especially if one pump operates alone at times. Dissimilar pumps or pumps placed at different heights requires special investigation.
 | Drawing a curve for 2 or more pumps is simple, draw 1st pump curve then draw 2nd curve, adding the flows each pump delivers at the same head. More curves can be added in the same way. Once the curve for two pumps has been drawn, add the system curve, the point where the system curve crosses the curve for two pumps , indicates the total flow from two pumps. Draw a horizontal line from this point back to the head axis. Where this horizontal line crosses the curves for a single pump indicates the amount of flow contributed by that pump to the total flow. |
The following sketch shows a system curve crossing a pump curve twice. This is an example of unstable operation. Note that if the first pump is operating at point ‘C’ when the second pump is started, the second pump will operate at shut head, delivering no flow as it will never be able to open the non return valve (required to prevent one pump discharging through the other when only one pump is operating). If this was to occur, the pump could eventually explode!
In some cases it may be possible to change the order of starting the pumps, and the curves can be drawn to check this operation, however if there is any indication of unstable operation or possibility of one pump being ‘over powered’ by another, contact us for assistance.
 |
The damage to a pump from cavitation can be severe. It may shorten seal and / or bearing life and damage volute, backcover, and even pipework beyond repair.
NPSH is a dirty word? There is enough fear of it to suggest it is. But why? Because some people will not accept that pumps don’t suck!
If you accept that a pump creates a partial vacuum and atmospheric pressure forces water into the suction of the pump, then you will find NPSH a simple concept.
NPSH(a) is the Nett Positive Suction Head Available, which is calculated as follows:
NPSH(a)= p + s – v – f
Where:
‘p’= atmospheric pressure,
‘s’= static suction (If liquid is below pump, it is shown as
a negative value)
‘v’= liquid Vapour Pressure
‘f’= Friction Loss
NPSH(a) must exceed NPSH(r) to allow pump operation without cavitation. (It is advisable to allow approximately 1 metre difference for most installations)
The other important fact to remember is that water will boil at much less than 100 deg C if the pressure acting on it is less than it’s Vapour Pressure, ie water at 95 deg C is just hot water at sea level, but at 1500m above sea level it is boiling water and vapour.
The Vapour Pressure of water at 95 deg C is 84.53 kPa, there was enough atmospheric pressure at sea level to contain the vapour, but once the atmospheric pressure dropped at the higher elevation, the vapour was able to escape. This is why Vapour Pressure is always considered in NPSH calculations when temperatures exceed 30 to 40 deg C.
NPSH(r) is the Nett Positive Suction Head Required by the pump, which is read from the pump performance curve. (Think of NPSH(r) as Friction Loss caused by the entry to the pump suction.)
If the speed or impeller diameter of a pump change, we can calculate the resulting performance change using:
Notes:
I know you are thinking “what does this have to do with anything”?, but if you can understand these ‘laws’ then you can make rough estimates without having to find full information (which might not be available anyway)
ie:
Boss: “Hey Joe, put this new pulley on that pump”
Joe: “But that will speed the pump up by about 10 % which increases the power by a third, do you reckon the motor will handle it ?”
For rough calculations you can adjust a duty point or performance curve to suit a different speed.
NPSH (r) is affected by speed / impeller diameter change = DANGER !
Only one thing is a better troubleshooting tool than pressure & vacuum gauges…that is:
readings from pressure & vacuum gauges taken prior to the problem.
ie: monitoring.
Gauge readings will help diagnose pump and system problems quickly, by reducing the possible causes.
Flow measurement would allow full diagnosis of pump performance but is sometimes expensive and usually not possible (Cheap versions include: V notch weir, measuring discharge from horizontal pipe, & timing of filling / emptying). System curves can be used in evaluating results.
Following is troubleshooting table for a typical pump showing symptom and possible cause.
| 1. Pump does not prime.. | Suction lift too great. Insufficient water at suction inlet. Suction inlet or strainer blocked. Suction line not air tight. Suction hose collapsed. Mechanical seal / packing drawing air into pump. |
| 2. Not enough liquid.. | Incorrect engine speed. Discharge head too high. Suction lift too great. Suction inlet or strainer blocked. Suction line not air tight. Suction hose collapsed. Mechanical seal drawing air into pump. Obstruction in pump casing/impeller. Impeller excessively worn. Delivery hose punctured or blocked. |
| 3. Pump ceases to deliver liquid after a time.. | Suction lift too great. Insufficient water at suction inlet. Suction inlet or strainer blocked. Suction hose collapsed. Excessive air leak in suction line. Mechanical seal / packing drawing air into pump. Obstruction in pump casing/impeller. Delivery hose punctured or blocked. |
| 4. Pump takes excessive power.. | Engine speed too high. Obstruction between impeller and casing. Viscosity and / or SG of liquid being pumped too high. |
| 5. Pump vibrating or overheating .. | Engine speed too high. Obstruction in pump casing/impeller. Impeller damaged. Cavitation due to excessive suction lift / Friction Loss. |
| 6. Pump leaking at seal housing.. | Mechanical seal damaged or worn. Due to: Dry Running during priming or loss of liquid. Cracking of ceramic seat can occur (thermal shock) after pump has run dry or against shut head (heating the water) and then cool water enters the pump casing. |
This information is not intended as a reference source for the design of pumping or associated systems, but to promote interest and further investigation by individuals and companies into the provision of reliable pumping equipment.
Due to the complexities of pumping systems in various industries and situations, it is not possible to predict the applications encountered, and therefore not possible to apply this information to all circumstances. Much of the information shown is personal opinion / experience gained within limited industries.
J.A.C. Pump Services (jacpumps.com) makes no representation or warranty with respect to the completeness or accuracy of the data or information contained herein, and assumes no liability for losses or damages resulting from the use or application of the data or information contained herein.
© 2019 J.A.C. Pumps